
Welcome to "Diversity at a Glance," where we highlight the diverse fabric of our university community. At HKUST, diversity is a vital aspect of our identity. We are dedicated to creating an environment where every individual feels welcomed, valued and empowered.
This page offers a snapshot of our community’s diversity, featuring key demographic data of our undergraduates and comparative insights. We invite you to explore these statistics, celebrate our diverse community, and join us in our journey towards a more inclusive campus.
Undergraduate Applications, Intakes and Graduation Rate by Gender
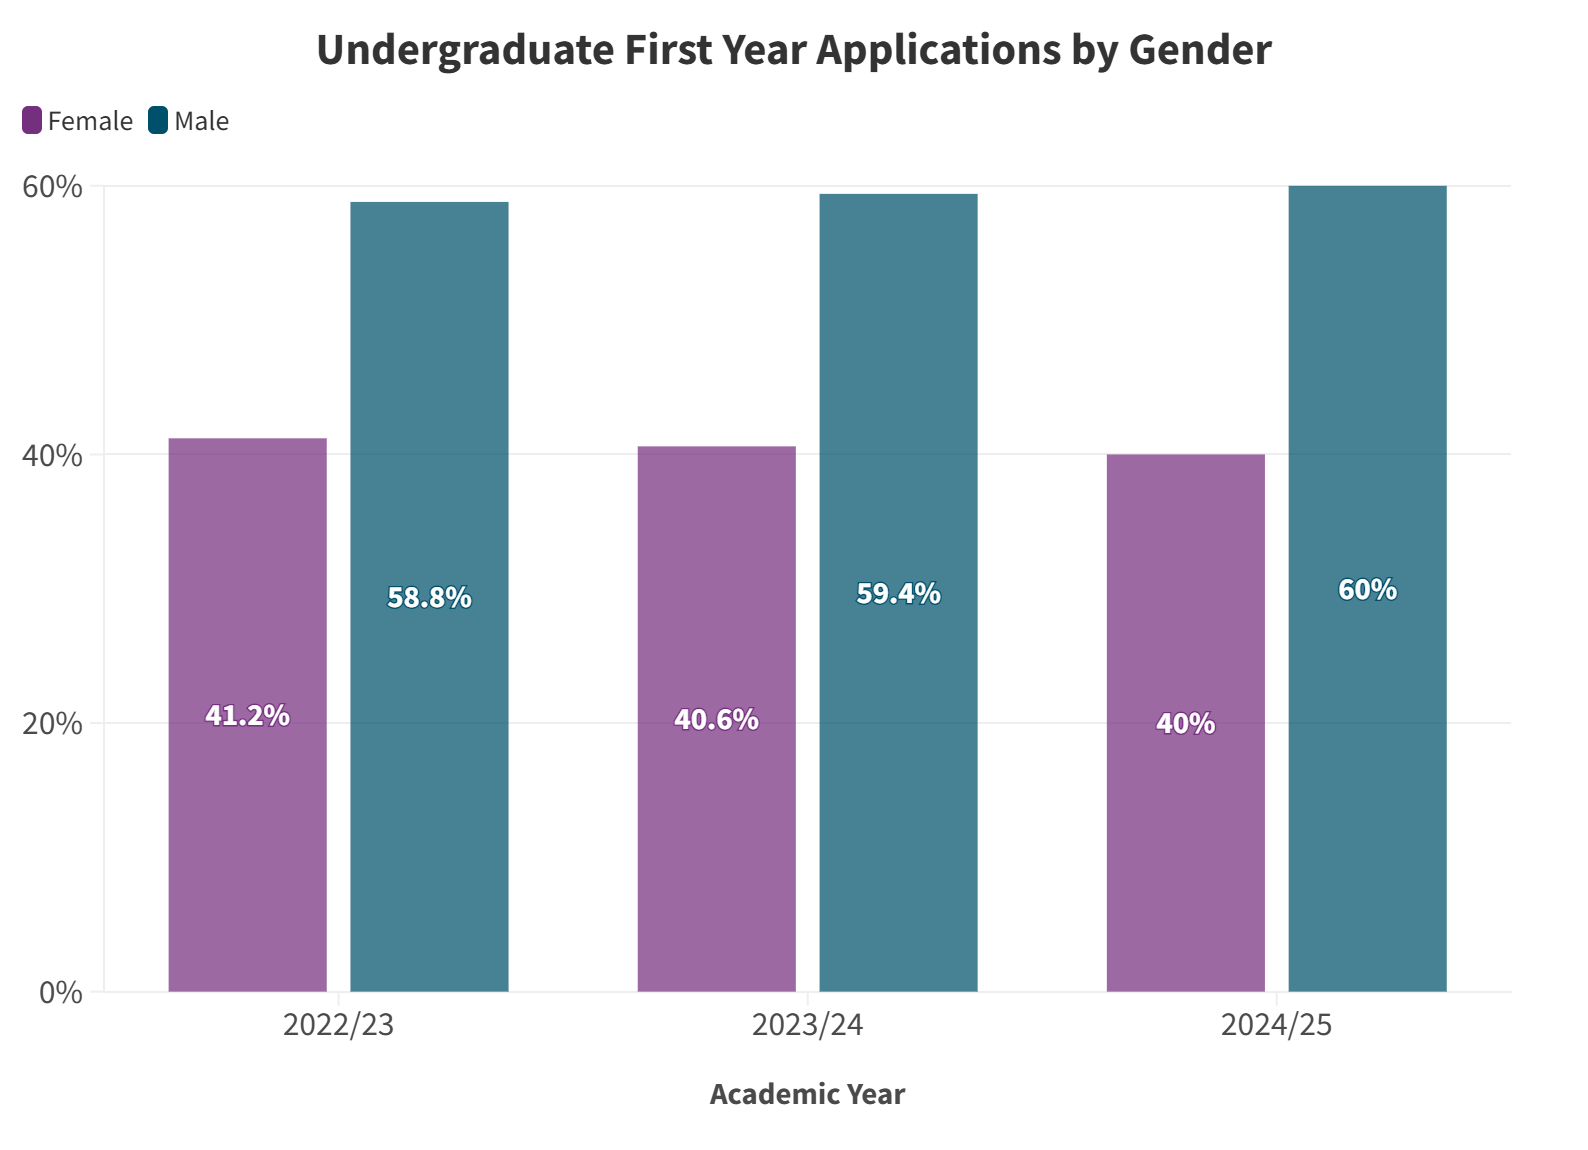
As an integral part of our commitment to gender equality and inclusivity, we measure and track a range of UG student data by gender. This data tracking is crucial to monitor and evaluate the adequacy of our strategies and efforts to promote gender equality.
Undergraduate First Year Applications by Gender
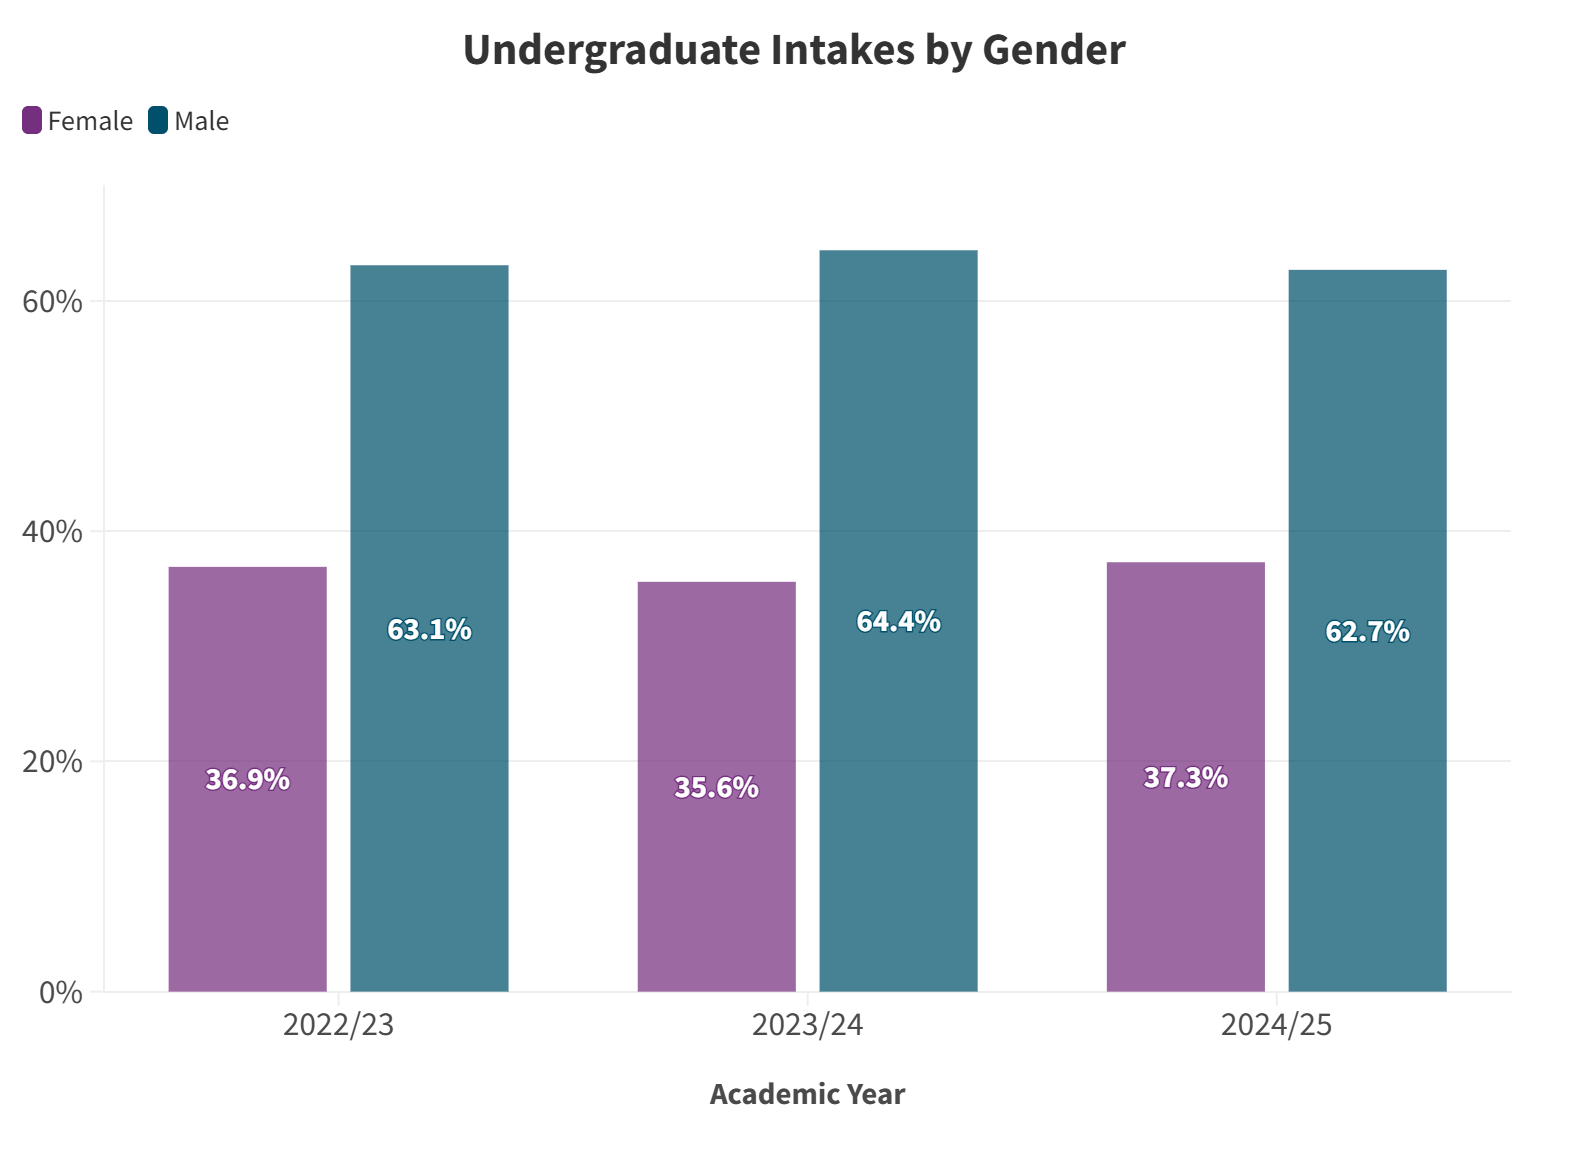
Undergraduate Intakes by Gender
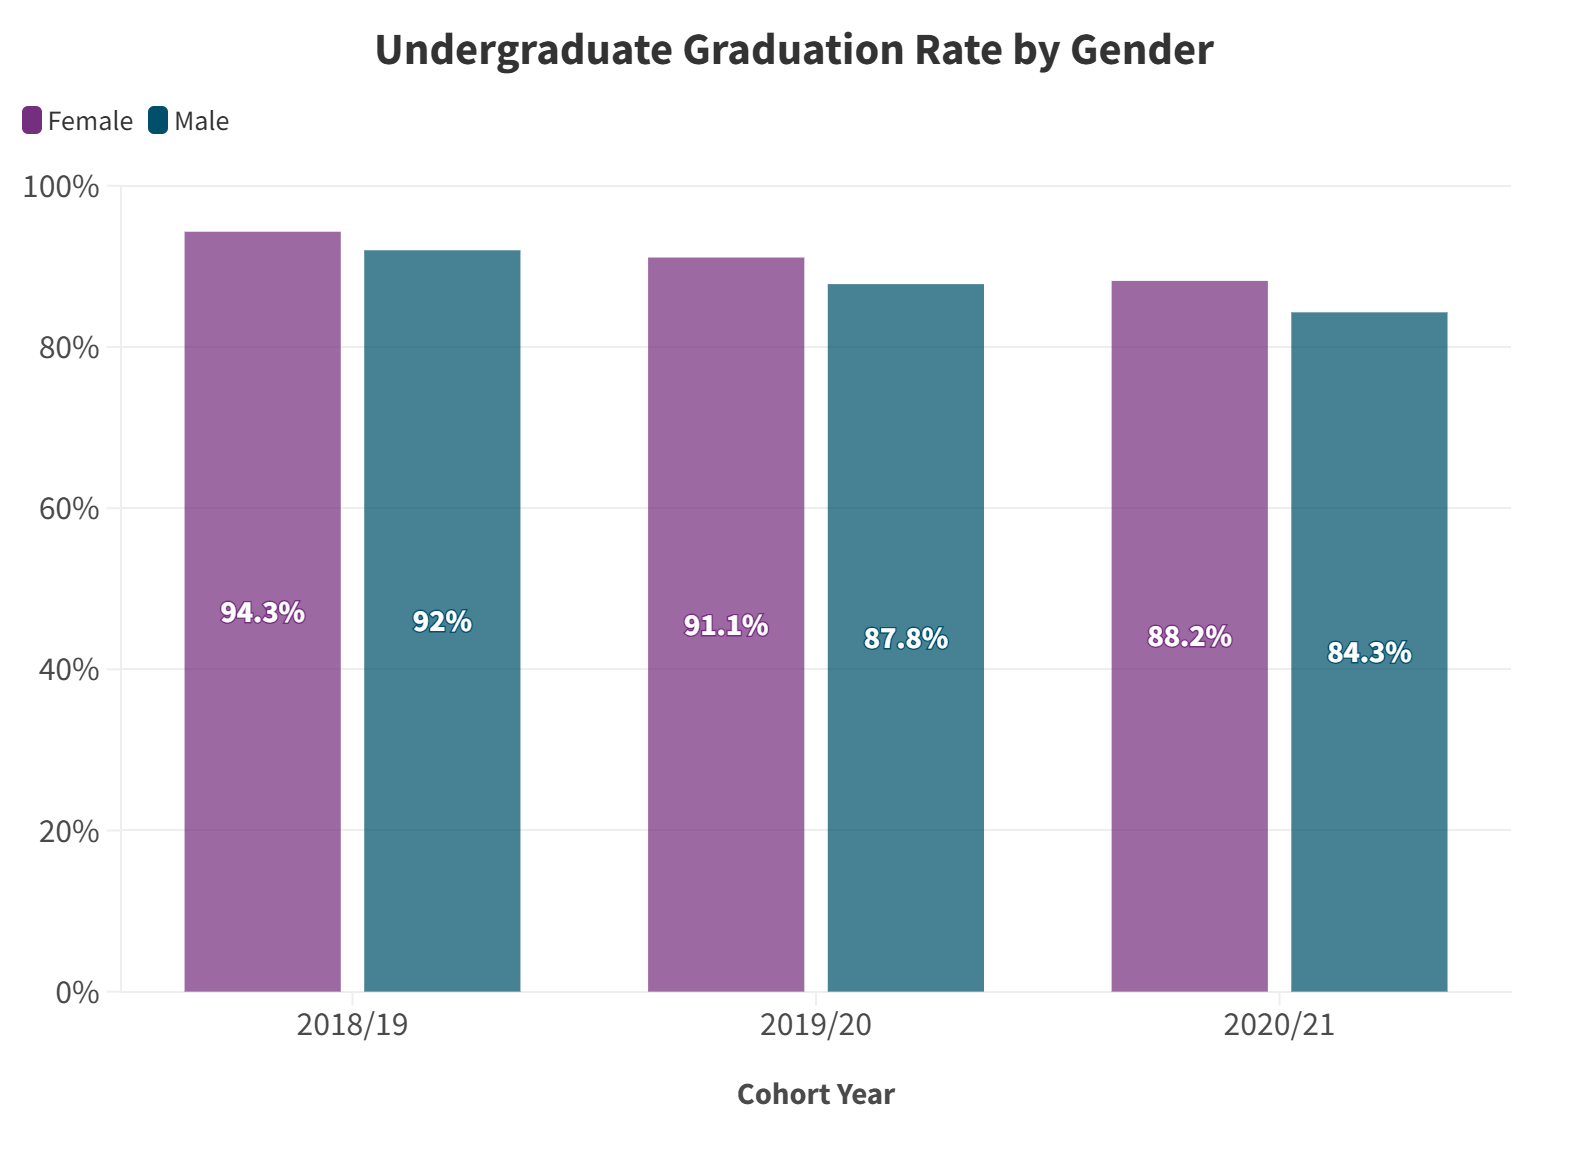
Undergraduate Graduation Rate by Gender
Student Figures of Underrepresented Groups
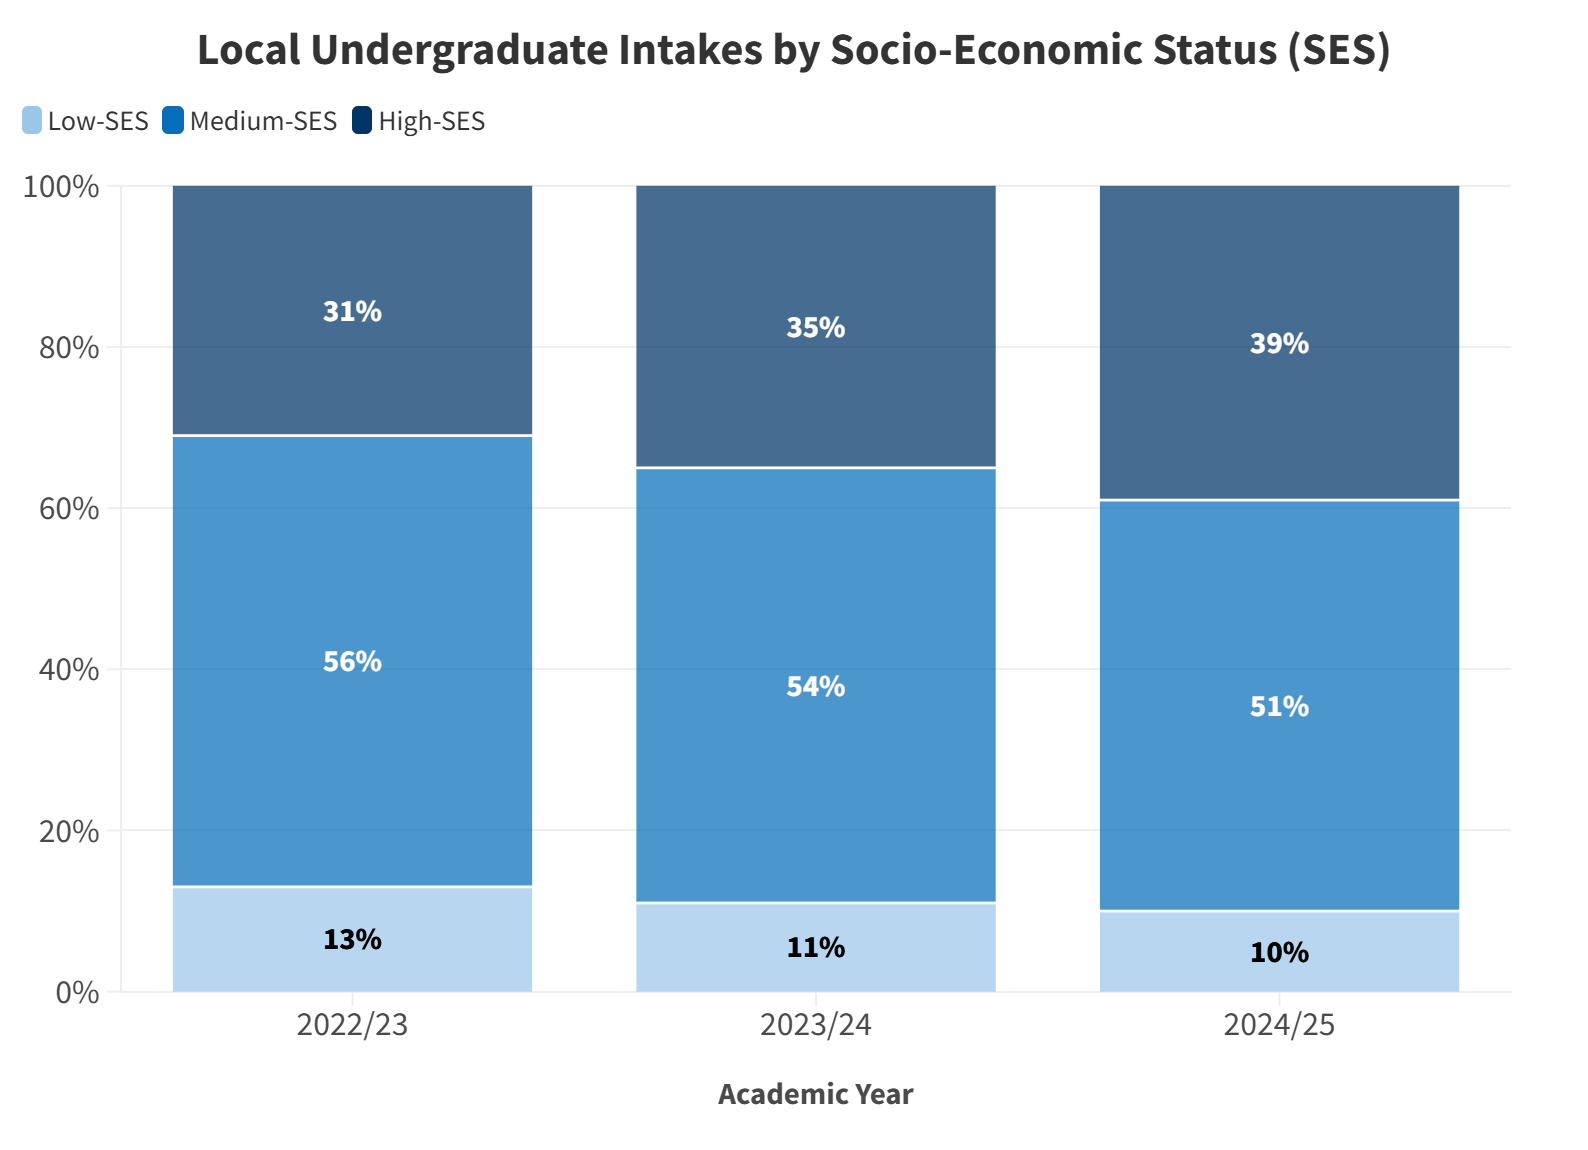
We systematically measure and track the student admissions of those from low socio-economic status background, students with financial needs and Special Educational Needs (SEN). This data tracking informs the University’s strategic planning and practices to support underrepresented student groups.
Local Undergraduate Intakes by Socio-Economic Status (SES)
Underrepresented Student Groups
%20Underrepresented%20Group%402x.png)
Note: SEN refers to an individual student's learning needs when facing academic challenges and difficulties in adjusting to the learning environment due to a disability or impairment, which can be a temporary or permanent condition.
(Click the table to enlarge it.)
Student International Diversity
HKUST is dedicated to fostering an inclusive environment where all students can thrive, regardless of students’ ethnic or racial background. Our initiatives include cultural exchange programs, international student orientation, and scholarships. Additionally, outreach programs are also launched to raise awareness and encourage applications from targeted countries, helping to build a multi-cultural learning community that enriches the educational experience for all.
Place of Origin of Non-local UG intakes
%20Place%20of%20Origin%20of%20Non-local%20UG%20intakes%402x.png)
Ethnicity of Local Non-Chinese Speaking UG Intakes
%20Ethnicity%20of%20Local%20Non-Chinese%20Speaking%20UG%20Intakes%402x.png)
Note: Asian intakes include Indian, Pakistani, Filipino, Korean, Nepalese, Japanese, Indonesian, Thai, Bangladeshi, Sri-Lankan and Vietnamese.
(Click the tables to enlarge them.)
Supporting Equity Across the Student Lifecycle
A range of support is available to build an inclusive and open environment for our students from underrepresented groups. For more information on the facilities, support, and services available, please visit our Inclusive Facilities and Services page.
SEN Student Support
Our Counseling and Wellness Center provides a wide range of support services and resources to our SEN students, including:
- Academic adjustment/ accommodations
- Assistive technology support
- Note-taking support
- Accessible format of course materials
- Campus accessibility
- Peer support, advocacy and inclusion activities
- Personal counseling and wellness
- Scholarships & internship opportunities
- Special arrangements for accessing student services
For more information, please visit our SEN student support page.
Financial Support
- To ensure students are not deprived of the right to receive education due to financial problems, students can apply for financial aid through different financial assistance schemes offered by the University. Please visit our SFAO website for details.
- Scholarships and financial aid designated to support students with SEN are available. Please visit here for further information.
- The WISE (Women in Science and Engineering) Scholarship established by HKUST aims to encourage high-achieving female students to pursue studies in science, engineering, or interdisciplinary studies by providing financial support and recognition. Click here to explore the stories of our WISE scholars.